
Every wholesaler makes decisions every day. Which customers to focus on, what to restock, when to push promotions. But without the right information, many of those choices are based on guesswork.
Most suppliers already have data. The challenge is finding it, trusting it and understanding what it is really telling you. Reports are hidden in ERPs, spreadsheets are outdated and by the time someone pulls a file, the numbers have already changed.
Good data does not mean more reports. It means knowing which metrics matter most and having them in one clear place that is live, accurate and ready to use.
Below, we look at the numbers worth watching and how they can guide smarter, faster decisions for your business.
Customer Drop-Offs: Where Revenue Is Slipping and Why
A drop-off does not always mean a customer has stopped ordering. It is often more gradual. A steady decline in revenue that can easily go unnoticed until it becomes serious.
Tracking revenue trends helps you spot those changes early. Look for customers whose overall spend is decreasing over time or who are ordering fewer lines than before. Seeing that pattern allows you to step in before the relationship weakens.
Once you notice a change, dig into the detail. Has their business gone quiet, or are they buying from someone else? Did a product go out of stock, or has pricing shifted?
Understanding these patterns helps you act early, have better conversations with customers and protect the revenue you already have.
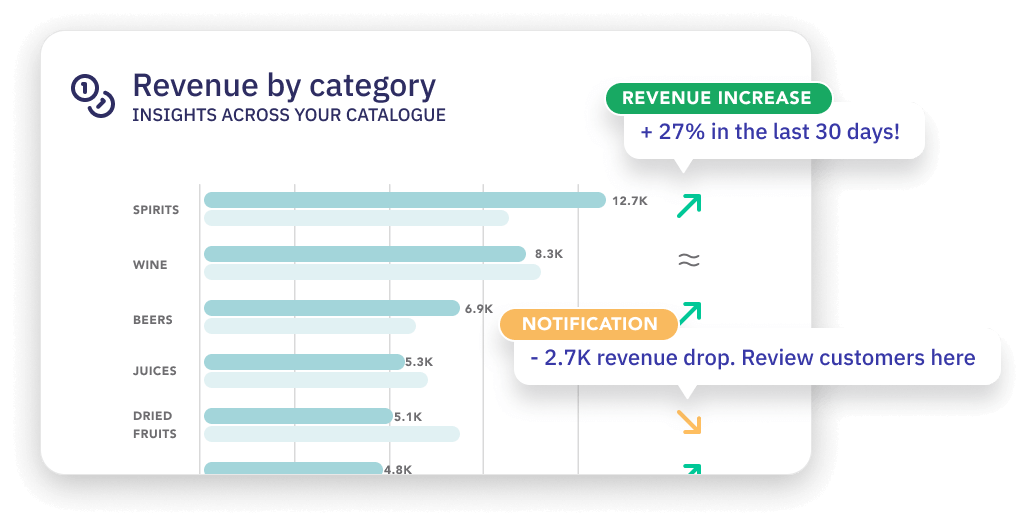
Product Performance: What Sells, What Slows and What to Watch
Your product data reveals just as much as your customer list. It shows which items are driving revenue and which ones are falling behind.
Your bestsellers show where demand is strong, but your slower movers tell an even more useful story. A sudden dip might point to a supply issue, a change in customer preferences, or simple seasonality.
For example, a drinks wholesaler might see mulled wine fall every spring or beer rise during summer. But if a popular product suddenly drops for no clear reason, that is a signal worth investigating.
You can also see which customers used to buy a certain product and have stopped, giving your sales team a clear starting point to re-engage and rebuild those sales.
Revenue Insights: Where the Business Is Growing or Slowing
For most wholesalers, revenue is the number that matters most. But the real value comes from understanding why it is changing.
Tracking revenue over time gives you a clear picture of where your income is growing, holding steady, or slipping. Comparing weeks, months, or seasons helps you see where the business needs attention.
If one customer’s sales are falling while others are rising, look deeper into their order history to find out why. Maybe it is a delivery issue, a pricing change, or a missing promotion. Once you know the reason, you can act with confidence instead of guessing.
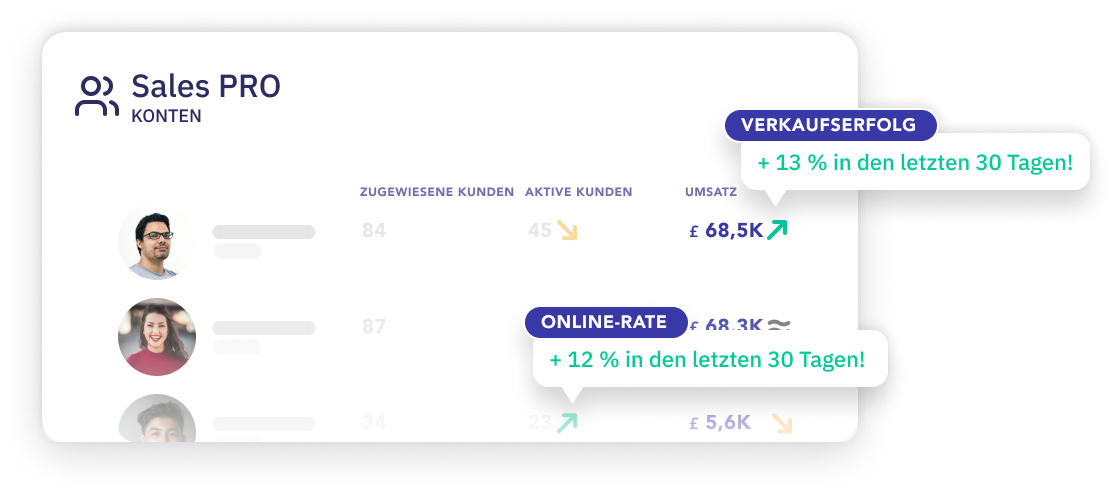
Sales Focus: Who Needs Attention and Where to Act
Sales teams often prepare for meetings using reports that are already out of date. With live data, they can see exactly what has changed that day, which customers have slowed down, which products are trending, and where new opportunities are appearing.
Managers can also use the data to compare performance across sales reps or customer groups. If one area is down, they can step in with support, training, or a targeted promotion.
The goal is not to track people. It is to give everyone the information they need to focus on the right conversations at the right time. And a little healthy competition between sales reps never hurts.
Smarter Growth: Using Data to Strengthen Relationships
For most regional wholesalers, growth does not come from finding new customers. It comes from getting more value from the ones they already have.
Data helps you find those opportunities. Maybe a customer regularly orders fresh produce but never buys dairy from you. Maybe they used to buy packaging materials but stopped a few months ago. These patterns reveal clear chances to upsell, cross-sell, or rebuild trust.
When you can see who buys what and when, your conversations become more personal and your service more proactive. That is what keeps customers loyal.
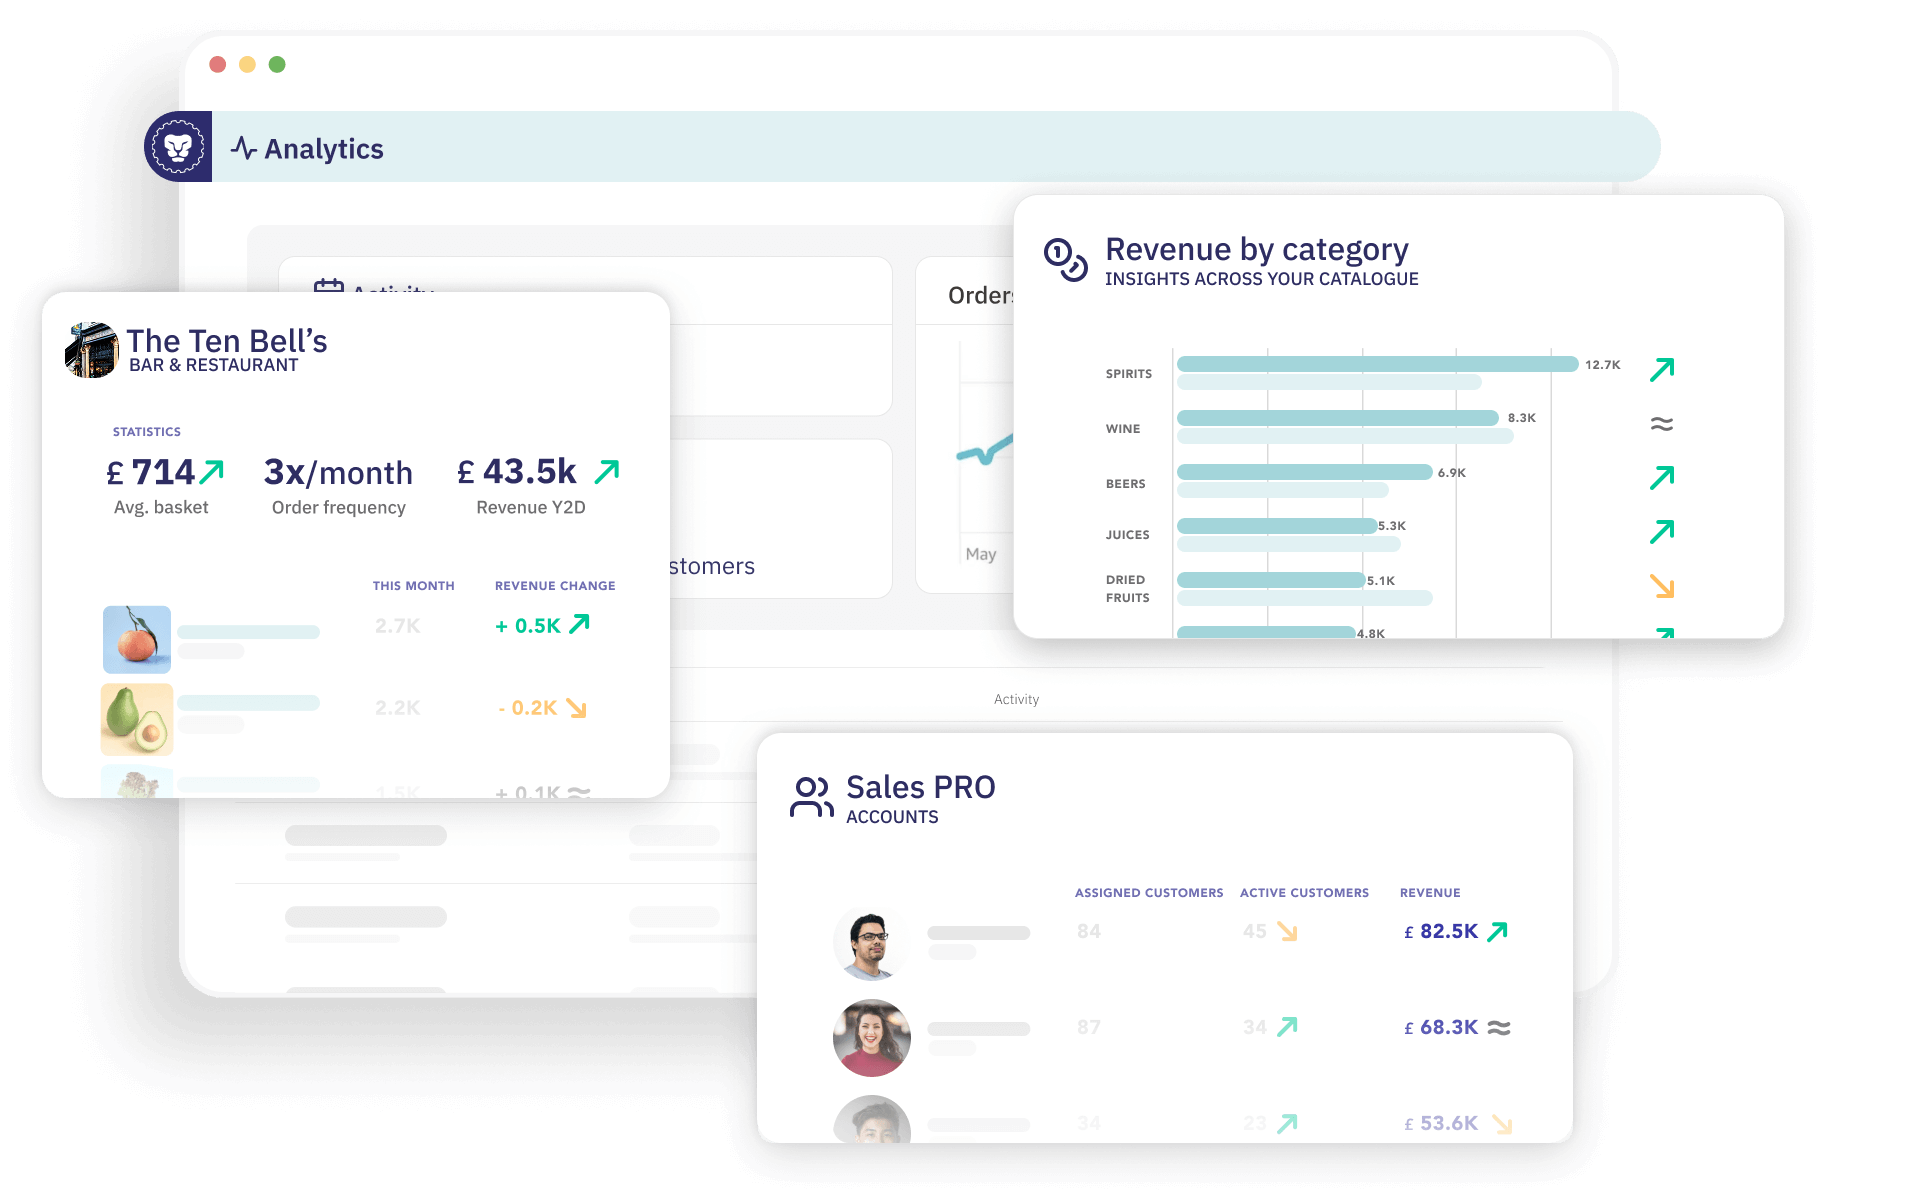
How Orderlion Makes It Simple
Orderlion Analytics brings all of these metrics together in an easy-to-read dashboard. You can filter by product, customer, or sales rep to see what is changing in real time.
It works with or without an ERP, and because it updates automatically, your data is always live. No exporting to Excel. No waiting for someone to pull a report. Just clear, accurate insights you can use right away.
Now Live: Orderlion Analytics
Real data. Real results.
Take a look for yourself! Click here to find out more!